


1. Machine Learning
1.1. What is machine learning?
- In 1959,Arthur Samuel thought of a new approach. He wondered if computers could infer a logic instead of giving them explicit instruction. In other words he wondered if machines could learn
- What if we give just i/p data to computer and te end results of previously accomplished task. Could a computer figure out best set of instructions that could yield given o/p based on the data provided to it

- Lets say we give computer the nos.in the left(i/p) and nos. in right(o/p)
- If the computer is able to identify what mathematical operation to apply to get the o/p then we say machine is learning
- Supervised learning
- After we train a model, which is a model that has learned the right set of instructions for a given task,going forward, we simply give it the i/p data and it applies internal instructions to get o/p.
- Useful in solving problems such as image recognition, text prediction and spam filter.
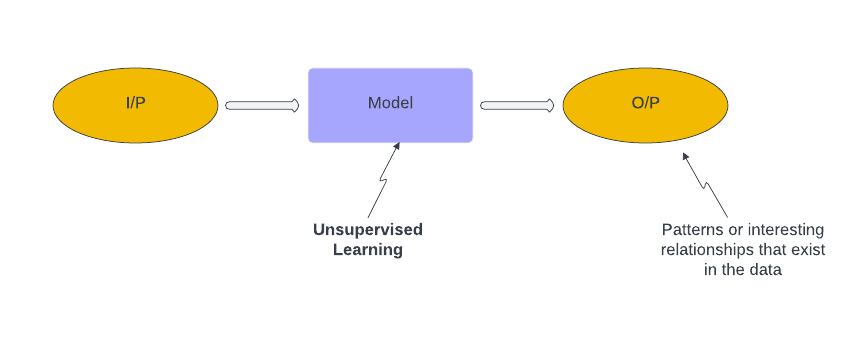
- Unsupervised learning
- In unsupervised learning we simply ask the machine to evaluate the i/p data and identify any hidden patterns or relationships that exist in the data.
- Useful in movie recommendation system
- Reinforcement learning
- In reinforcement learning there are two primary entities
- i.e. Agent and Environment
- Agent figures out the best way to accomplish a task through a series of cycles in which the agent takes an actoin and receives immediate positive or negative feedback on the action from the environment
- Useful in pc game engines , robotics and self driving cars
- In reinforcement learning there are two primary entities
1.2. What is not machine learning?
- Some times its said that ML is simply glorified statistics, it is true that ML does borrow a lot of concepts stats, however ML also does borrow a lot of concepts form IT, Calculus and even biology
- Objective of ML: Its used in trying to predict what's going to happen in future(What's next?)
- Objective of Stats model: They are mostly concerned with the relationship between variables(What is?)
- With Stats model we understand what happens to variable B as a result of a change in variable A.
- With Stats model we understand what happens to variable B as a result of a change in variable A.
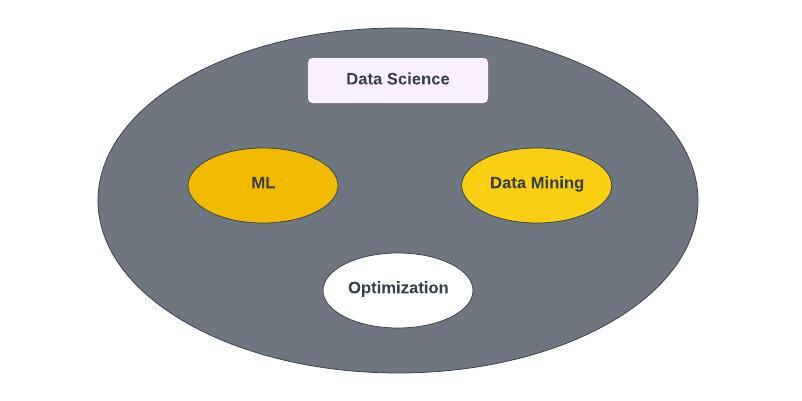
- Difference between ML and Data Mining
- ML approaches are primarily focused on prediction, the make predictions based on the known properties of the data.
- Data mining is focused on discovery of previously unknown property in data.
- In field of business analytics
- ML = Predictive analytics
- Data Mining = Descriptive analytics
- Optimization =Prescriptive analytics
- We use Descriptive analytics to track and analyses existing data in order to identify new patterns.
- We use predictive analytics to analyses past trends in order to predict the likelihood of future outcomes.
- We use prescriptive analytics to recommend actions based on prior performance
1.3. What is unsupervised learning?
- Unsupervised learning is the process of building a descriptive model.
- Descriptive models are used to summarize and group data in new and interactive ways
- e.g. Customer Segmentation
- Suppose you want to group your customers based on how similar they are to each other in order to better market your products to them.
- Here we have two kinds of info:
- 1) Historical info about the spending habits of our customers
- 2) Demographic info about each customer (age, gender etc)
- Unsupervised learning is the process of building a descriptive model.
1.4. What is supervised learning?
- Supervised learning is the process of training a predictive model.
- Predictive models are used to assign labels to unlabeled data based on patterns learned from previously labeled historical data
- If we want to predict the outcome of a new event we can use predictive model that has been trained on similar events to predict the outcome
- e.g. Loan outcomes
- Suppose you want to predict the loan risk of individual customer based on the info they provide on their loan application
- Develop a ML model that predicts whether a particular customer will or will not default on a loan
- Info available to us:
- 1) descriptive data about each loan (Loan amount, annual salary etc)
- 2) The outcome of each previous loans

- Independent Data+ Dependent Data = Training Data
1.5. What is Reinforcement learning?
- Reinforcement learning is the science of learning to make decision from interaction
- It is similar to early childhood learning
- Reinforcement learning attempts to accomplish two distinct learning objectives:
- 1) Finding previously unknown solutions to a problem
- e.g. Machine playing chess
- 2) Finding online solutions to problems that arise due to unforeseen circumstances
- e.g. Machine that is able to find an alternate route due to landslide in the current route

- FeedBack:(State , Reward)
- The state describes the impact of the agent's previous action their environment and the possible actions the agent can take. Each action is associated with a numeric reward that the agent receives as a result of taking a particular action.
- Exploitation : Choosing the action that maximizes reward
- Exploration : Choosing an action with no consideration of the reward
- 1) Finding previously unknown solutions to a problem
- Reinforcement learning is the science of learning to make decision from interaction
1.6. What are the steps to Machine Learning?
- 1) Data Collection: Identify and acqiure the data you need for ML
- 2) Data Exploration: Understand your data by describing and visualizing it
- 3) Data Preparation: Modify your data so it works for the type of ML you intend to do
- 80% of time is usually spent in these above three stages
- 4) Modelling: Apply a ML approach to your data
- 5) Evaluation: Assess how well your ML approach worked
- Iterate in above two steps to find the best model
2.Collecting Data For ML
2.1. Things to consider when collecting data
- Identify and acquire data you need for ML
- There are 5 key considerations we need to keep in mind
- 1) Accuracy
- 2) Relevance
- 3) Quantity
- 4) Variability
- 5) Ethics
2.2 How to import data in python
- Pandas package: It provides several easy to use functions for creating / structuring and importing data
import pandas as pdHere pd is an Allies, it allows us to refer functions of the package by simply referring topd.functionName()- Ways of representing data:
- 1) Series: It is heterogenous, 1D array like data structure with labelled rows
bricks1=pd.Series(members)
- 2) DataFrame: It is heterogenous, 2-D data structure with labelled rows and columns
- We can think of DataFrame as a collection of several series
- DataFrame is very similar to a spreadsheet or a relational database table
bricks2=pd.DataFrame(members)
- 3) Import data from a csv file
brics3=pd.read_csv("brics.csv")
- 4) Import data from an excel file
brics4=pd.read_excel("brics.xlsx")- For excel with multiple sheets:
brics5=pd.read_excel("brics.xlsx",sheetname="xyzabc")
- 1) Series: It is heterogenous, 1D array like data structure with labelled rows
3. Understanding data for machine learning
3.1. Describe your data
- Data exploration: Understand your data by describing it and visualizing it
- Data exploration enables us to answer questions such as:
- How many rows and columns are there in data?
- What type of data do we have?
- Are there missing, inconsistent or duplicate values in the data?
- In ML we use certain key terms to describe the structure and nature of our data
- Instance: An instance is an individual independent example of the concept represented by the data set
- Feature: Property or characteristics of an instance
- Categorical feature: Attribute that holds data stored in disrete form
- Continuous feature: Attribute that holds data stored in the form of an integer or real no.
- Dimensionality: The no. of features in a dataset
- Sparsity & Density: The degree to which data exists in a dataset
- e.g. If 20% of the value in the dataset are missing or undefined, we say that data is 20% sparse. Density is the compliment of sparsity
3.2. How to summerise data in Python
- The pandas DataFrame provides several easy to use methods that helps us describe and summerize data
- One of these methods is
info() import pandas as pdwashers=pd.read_csv("washers.csv")washers.info(): We can get concise summary of its rows and columnswashers.head(): head() returns first few rows in the DataFrame- Simple aggregation:
describe()It returns a statistical summary for each of the columns in a DataFrame- NOTE: The descriptive stats returned by the describe() depends on the data type of a column
washers[['BrandName']].describe()washers[['Volume']].describe()
value_Counts()It returns a series containing counts of unique values- The resulting object will be in descending order so that the first element is the most frequently occuring element
washers[['BrandName']].Value_Counts()washers[['BrandName']].Value_Counts(normalize=True):To get o/p in percentilereprestation
mean()It returns the averagewashers[['Volume]].mean()
- Group aggregation:
- We get specific aggregations at the group level
- For e.g. We can compute the average volume of washers by brand
washers.groupby('BrandName')[['Volume]].mean(): This result is sorted by BrandName
- We get specific aggregations at the group level
3.3. Visualize your data
- Depending on type of question we are trying to answer there are 4 major types of visualization we could use:
- 1) Comaprison
- Comparison visualization illustrates the difference between two or more items at a given point in time or over a period of time.
- It answers questions such as:
- Is a feature important?
- Does the median value of a feature differ between subgroups?
- Does a feature have outliers?
- 2) Relationship
- Rekationship visualization illustrates the corelation between two or more variables
- It answers questions such as:
- How do two features interact with each other?
- Is a feature important?
- Does feature have outliers?
- 3) Distribution
- Distribution visualization shows the statistical distribution of the value of a feature
- It answers questions such as:
- Does a feature have outliers?
- How spread out are the values of a feature?
- Are the values of a feature symmetric or not
- 4) Composition
- Composition visualization shows the component makeup of the data
- It answers questions such as:
- How much does a subgroup contributes to the total?
- What is the relative or absolute change in the composition of a subgroup over time?
- 1) Comaprison
- Depending on type of question we are trying to answer there are 4 major types of visualization we could use:
3.4 How to visualize data in pyhton
- One of the most popular visualization packages in python is matplotlib
matplotlib inline:To ensure that the plots we create will appear right after our code
- 1) Relationship visualization:
- These types of visualizations are used illustrate the co=relation between two or more continuous variables
vehicles.plot(kind='scatter', x='citymap', y='co2emission')scatter plots are one of the most commonly used relationship visualization, they show how one variable changes in response to a change in another
- 2) Distribution visualization:
- Distribution visualization illustrates the statistical distribution of the values of a feature
- One of the most commonly used distribution visualization is histogram
- With histogram we can figure out which values are most common for a feature
vehicles['co2emission'].plot(kind='hist')
- 3) Comparison visualization:
- Comparison visualizations are used to illustrate the difference between two or more items at a given point in time or over a period of time
- Most commonly used comparison visualization is box-plot
- Using box-plot we can compare the distribution of values for a continuous feature against the values of a categorical feature
- 4) Composition visualization:
- These type of visualization show the component makeup of data
- Most commonly used composition visualization is stacked bar
- Stacked bar shows how much a sub-group contributes to the whole
- One of the most popular visualization packages in python is matplotlib
4. Preparing data for ML
4.1. Common data quality issues
- Missing data
- Outiers
4.2. How to resolve missing data in python
mask=students['state'].isnull() mask //It will give the o/p where state==NULL will be true- dropna()
- It is used to remove missing values
- examples;
students.dropna()students=students.dropna(subset=['state','zip'],how='all')
- fillna()
- It replaces the missing value with something else
students=students.fillna({'gender':'Female'})
- .loc[ ]
- To apply mask as a row filter
students.loc[mask,:]
4.3. Normalizing your data
- Normalization ensures that values share a common property
- Normalization often involves scaling data to fall within a small or specified range
- Normalization is often required ,it reduces complexity and improves interpretability
- Ways of nomralization:
- 1) Z-score normalization
- 2) Min-Max normalization
- 3) log transformations
4.4. How to normalize data in python
- Refer online documentations
4.5. Sampling your data
- This is the process of selecting a subset of the instances in a data in a proxy for the module
- The original dataset is referred to as the population, while the subset is known as a sample
- Sampling without replacement
- Sampling with replacement
- Stratified sampling
4.6. How to sample data in python
- We usually have to split the rows in our data training and test sets using one of several sampling approaches
- use
train_test_split():By default train_test_split() allocates 25% of the original data to the test set
- use
- We usually have to split the rows in our data training and test sets using one of several sampling approaches
4.7. Reducing the dimensionality of your data
- The process of reducing the no. of features in a dataset prior to modelling
- Reduces complexity and helps avoid the curse of dimensionality
- Curse of dimensionality means that the error increases with the increase in no. of features
- Two approaches to dimensionality reduction:
- 1) Feature selection
- 2) Feature abstraction
5. Types of ML models
- Depending on the nature of the dependent variable supervised ML can be divided into:
- Classification:
- Supervised ML problem where the dependent variable is categorical
- e.g. Yes/No ,colour etc
- Supervised ML problem where the dependent variable is categorical
- Regression:
- Supervised ML where the dependent variable is continuous
- e.g. age, income, temperature etc.
- Supervised ML where the dependent variable is continuous
- Classification:
- Evaluation
- In order to get an unbiased evaluation of performance of our model:
- You must train the model (Training data) with a different dataset then the ones which is used to evaluate them (test data)
- In order to get an unbiased evaluation of performance of our model:
- Depending on the nature of the dependent variable supervised ML can be divided into: